
Overview
You will learn
- How to use the Logging component to log messages
- How to change the log level
- How to upload and view logs in the SAP Mobile Services cockpit


Prerequisites
Prerequisites
- You have Set Up a BTP Account for Tutorials. Follow the instructions to get an account, and then to set up entitlements and service instances for the following BTP services.
- SAP Mobile Services
- You completed Try Out the SAP BTP SDK Wizard for Android.
Steps
In Android Studio, on Windows, press
Ctrl+N, or on a Mac, presscommand+O, and enterSettingsViewModelto openSettingsViewModel.kt.On Windows, press
Ctrl+F, or on a Mac, presscommand+F, and enterinitto navigate to theinitblock.Note that the following code block contains two logger statements:
init {
    //init from shared preference
    viewModelScope.launch(Dispatchers.Default) {
        preferencesFlow.collect { userReference ->
            logger.debug("get preference as {}", userReference.logSetting)
            _settingUIState.update { uiState ->
                uiState.copy(level = LogPolicy.getLogLevel(userReference.logSetting))
            }
        }
    }

    val consentUsage = UserSecureStoreDelegate.getInstance().consentStatus(ConsentType.USAGE)
    val consentCrashReport =
        UserSecureStoreDelegate.getInstance().consentStatus(ConsentType.CRASH_REPORT)
    logger.debug(
        "init consent data : consentUsage {}, consentCrashReport {}",
        consentUsage,
        consentCrashReport
    )

    ... ...
These messages will be logged when the app’s log level is set to Debug or Path and the app’s Settings menu item is opened.
In Android Studio, on Windows, press
Ctrl+N, or on a Mac, presscommand+O, and enterEntitySetListActivityto openEntitySetListActivity.kt.On Windows, press
Ctrl+F12, or on a Mac, presscommand+F12, and enteronOptionsItemSelectedto navigate to theonOptionsItemSelectedmethod.Note that the following method contains two LOGGER statements:
override fun onOptionsItemSelected(item: MenuItem): Boolean {
    LOGGER.debug("onOptionsItemSelected: " + item.title)
    return when (item.itemId) {
        R.id.menu_settings -> {
            LOGGER.debug("settings screen menu item selected.")
            Intent(this, SettingsActivity::class.java).also {
                this.startActivity(it)
            }
            true
        }
These messages will be logged when the app’s log level is set to Debug or Path and the app’s Settings menu item is opened.
Navigate to the entity list screen and open the app’s menu.
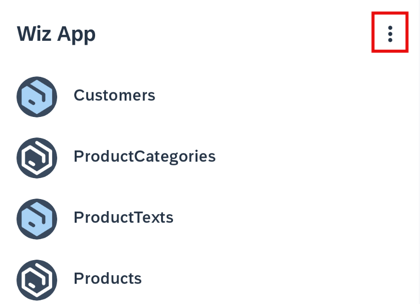
Settings menu button Choose Settings.
Select Log Level displayed in Logging on the Settings screen.
Set the level to Debug.
Navigate back to the entity list screen, then back into the Settings screen to see the effect of changing the log level.
Examine the Logcat (located at the bottom of the Android Studio screen, click it and you can see the logs). In the filter, add the name of the class that we are interested in seeing the log from:
com.sap.wizapp.ui.odata.viewmodel.SettingsViewModel.Notice that the messages were logged since the log level of the app was set to Debug or Path.
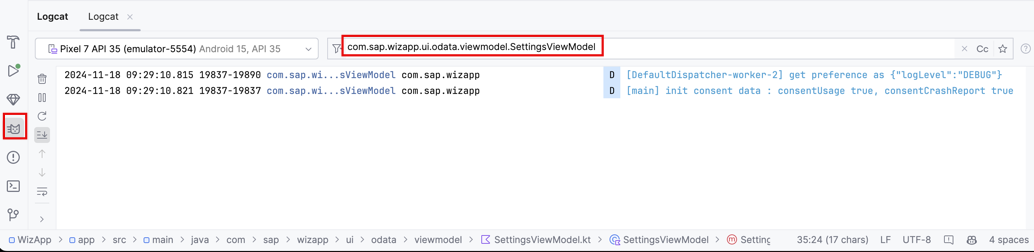
Debug log level output
The SDK libraries also log output based on the app’s log level.
Change the filter to
com.sap.cloud.mobile.foundation.Exit the app and you will see the logged lines from the foundation library.

Debug log level output for foundation
Navigate to the entity list screen and open the app’s menu.
Settings menu button Choose Settings.
Select Log Level displayed in Logging on the Settings screen.
Set the level to Debug.
Navigate back to the entity list screen, then back into the Settings screen to see the effect of changing the log level.
Examine the Logcat (located at the bottom of the Android Studio screen, click it and you can see the logs). In the filter, add the name of the class that we are interested in seeing the log from:
com.sap.wizapp.mdui.EntitySetListActivity.Notice that the messages were logged since the log level of the app was set to Debug or Path.

Debug log level output
The SDK libraries also log output based on the app’s log level.
Change the filter to
com.sap.cloud.mobile.foundation.Press Back to exit the app and you will see the logged lines from the foundation library.
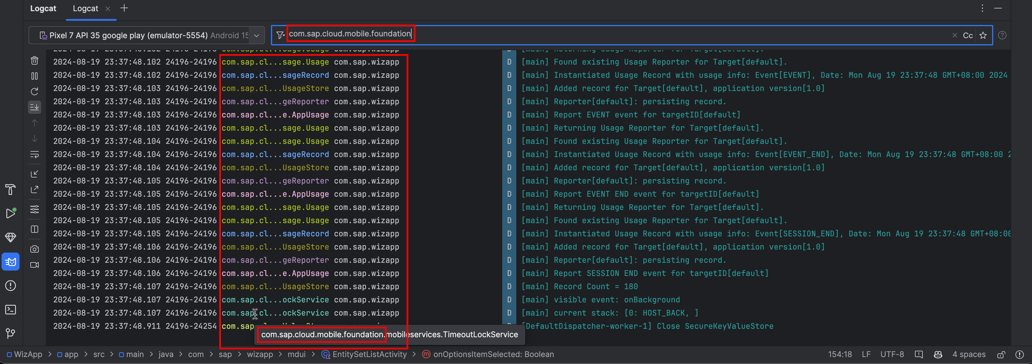
Debug log level output for foundation
Navigate back to the Settings screen in the app, and this time tap Upload Log right below Log Level.
A Toast message is displayed confirming that the upload succeeded.

Log upload succeeded In the Mobile Services cockpit, navigate to Mobile Applications > Native/MDK > btp.sdk.wizapp > Client Log Upload.
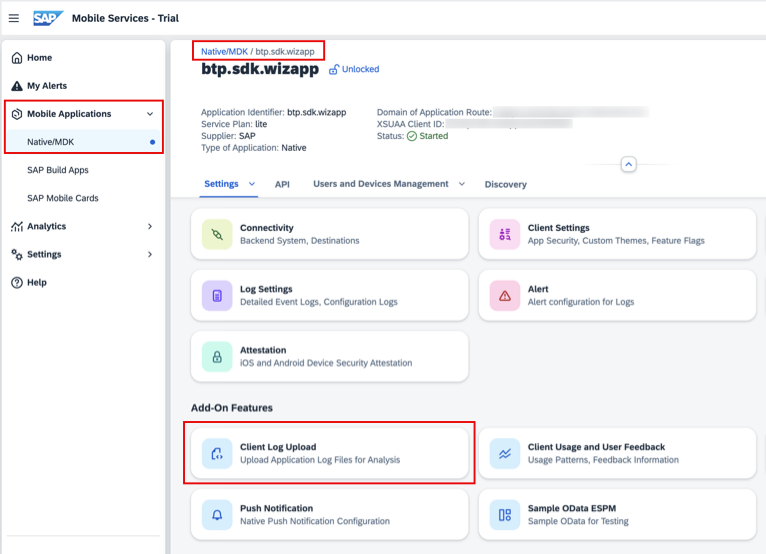
Mobile Applications > Native/MDK > btp.sdk.wizapp > Client Log Upload Select the Error Logs tab and you will see the log you just uploaded in the Error level list. If the log doesn’t appear immediately, wait for a few moments, then click Go to refresh the view.
You can inspect the log details in the browser by clicking on its table entry.
Select the Log Files tab and you will see the log files you just uploaded in the list. You can download the files by clicking Download.

View log details Additionally, you can access the logs locally on an emulator. You can browse the file system of an Android emulator using the Device Explorer to view the log files as shown below: data > data > com.sap.wizapp (or the package name of your project) > files.

View logs in emulator You can manage the initial log level of the application and the ability for mobile services to accept logs on the Configuration page, as shown below.

Log Policy
Navigate back to the Settings menu in the app, and this time tap Upload Log right below Log Level.
A Toast message is displayed confirming that the upload succeeded.

Log upload succeeded In the Mobile Services cockpit, navigate to Mobile Applications > Native/MDK > btp.sdk.wizapp > Client Log Upload.
Mobile Applications > Native/MDK > btp.sdk.wizapp > Client Log Upload Select the Error Logs tab and you will see the log you just uploaded in the Error level list. If the log doesn’t appear immediately, wait for a few moments, then click Go to refresh the view.
You can inspect the log details in the browser by clicking on its table entry.
Select the Log Files tab and you will see the log files you just uploaded in the list. You can download the files by clicking Download.
View log details Additionally, you can access the logs locally on an emulator. You can browse the file system of an Android emulator using the Device Explorer to view the log files as shown below: data > data > com.sap.wizapp (or the package name of your project) > files.
View logs in emulator You can manage the initial log level of the application and the ability for mobile services to accept logs on the Configuration page, as shown below.
Log Policy
For further information on logging, see Logging.
Congratulations! You have explored how you can use the logging feature to debug or support a deployed application.
Resources
Discussion
Share feedback on this tutorial or join the conversation in SAP Community.