
Overview
You will learn
- What SAP HANA Graph is
- How to create graph workspace using sample data


Prerequisites
Prerequisites
- SAP HANA Cloud, e.g. SAP HANA Cloud trial, or
- SAP HANA 2.0 SPS 04 or higher with XSA, e.g. SAP HANA, express edition
- Completed SAP HANA Database Explorer Overview
Steps
SAP HANA Graph is an integral part of SAP HANA core functionality. It expands the SAP HANA with native support for graph processing and allows you to execute typical graph operations on the data stored in an SAP HANA system.
Graphs are a powerful abstraction that can be used to model different kinds of networks and linked data coming from many industries, such as logistics and transportation, utility networks, knowledge representation, text processing, and so on.
In SAP HANA, a graph is a set of vertices and a set of edges. Each edge connects two vertices; one vertex is denoted as the source and the other as the target. Edges are always directed and there can be two or more edges connecting the same two vertices. Vertices and edges can have an arbitrary number of attributes. A vertex attribute consists of a name that is associated with a data type and a value. Edge attributes consist of the same information.

For more please refer to online documentation for SAP HANA Cloud used in these exercises.
You will have a model and data representing a part of the real life ski resort Pinzolo/Madonna di Campiglio in Italy. The full-size picture of the map is available in the file and the small-scale version can be found below.

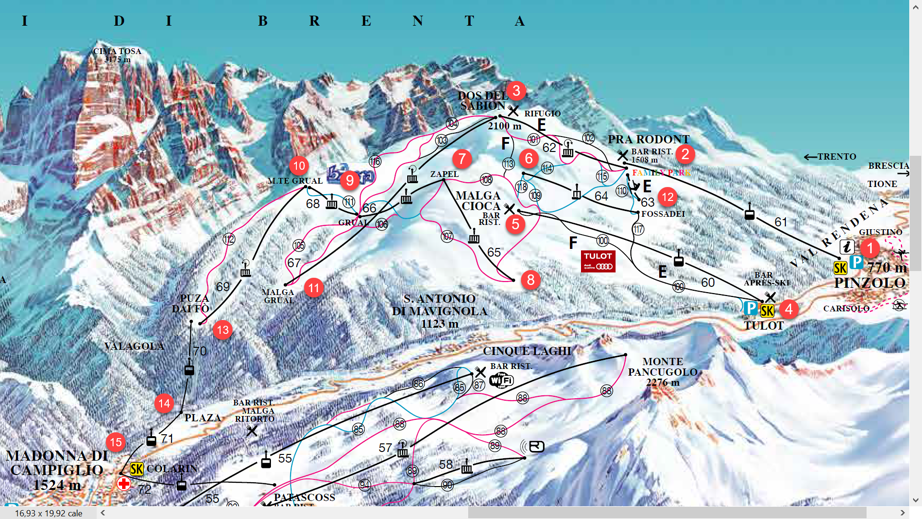
Every station got an id number (in red circle) and will become a vertex of our graph. They have additional attributes:
ticket_office = 'TRUE'(string, not boolean), is where you buy a ticket and start the day. These are stations 1, 4, 15.restaurant = 'TRUE'is a place to have a break for a delicious Italian coffee, or to recharge with a few slices of pizza. These are stations 2, 3, 5.
Stations are connected by either lifts (to go up) or runs (to ski down). These connections will be edges in the graph with a few attributes:
- ’lift’ or ‘run’ will be their
modeattribute, startandendwill be ids of connected stations,- each of them will have attribute
length, measured in meters, - additionally, runs will have ‘blue’, ‘red’, or ‘black’ values in the attribute
difficulty, - attribute
statusis either ‘open’ or ‘close’, reflecting if particular lift or run can be used. By default, all connections will be open.
Open SAP HANA Database Explorer’s SQL Editor and connect to your database.
The assumption in these exercises is that you are using a schema SKIING, but you can change it to any other schema of your choice.
Copy the following code into your SQL Editor.
--DROP SCHEMA "SKIING" CASCADE;
CREATE SCHEMA "SKIING";
SET SCHEMA "SKIING";

CREATE TABLE "NODES"(
	"node_id" INTEGER NOT NULL,
	"name" NVARCHAR(16),
	"ticket_office" NVARCHAR(4),
	"restaurant" NVARCHAR(4),
	PRIMARY KEY (
		"node_id"
	)
);

CREATE TABLE "EDGES"(
	"edge_id" INTEGER NOT NULL,
	"length" INTEGER,
	"difficulty" NVARCHAR(16),
	"start" INTEGER NOT NULL,
	"end" INTEGER NOT NULL,
	"mode" NVARCHAR(8),
	"status" NVARCHAR(8),
	PRIMARY KEY (
		"edge_id"
	)
);

ALTER TABLE "EDGES" ADD FOREIGN KEY ("start") REFERENCES "NODES" ("node_id") ON UPDATE CASCADE ON DELETE CASCADE ENFORCED VALIDATED
;
ALTER TABLE "EDGES" ADD FOREIGN KEY ( "end" ) REFERENCES "NODES" ("node_id") ON UPDATE CASCADE ON DELETE CASCADE ENFORCED VALIDATED
;Execute all statements.
You should see two tables created in your schema.

Open review definitions of both tables.

Copy following code into your SQL Editor and execute it.
SET SCHEMA "SKIING";

--Populate NODES
INSERT INTO "NODES" VALUES (1, 'Pinzolo', 'TRUE', '') ;
INSERT INTO "NODES" VALUES (2, 'Pra Rodont', '', 'TRUE') ;
INSERT INTO "NODES" VALUES (3, 'Dos Del Sabion', '', 'TRUE') ;
INSERT INTO "NODES" VALUES (4, 'Tulot', 'TRUE', '') ;
INSERT INTO "NODES" VALUES (5, 'Malga Ciocia', '', 'TRUE') ;
INSERT INTO "NODES" VALUES (6, 'Malga Ciocia Up', '', '') ;
INSERT INTO "NODES" VALUES (7, 'Zapel', '', '') ;
INSERT INTO "NODES" VALUES (8, 'Zapel Down', '', '') ;
INSERT INTO "NODES" VALUES (9, 'Grual', '', '') ;
INSERT INTO "NODES" VALUES (10, 'Mte Grual', '', '') ;
INSERT INTO "NODES" VALUES (11, 'Malga Grual', '', '') ;
INSERT INTO "NODES" VALUES (12, 'Fossadei', '', '') ;
INSERT INTO "NODES" VALUES (13, 'Puza Daifo', '', '') ;
INSERT INTO "NODES" VALUES (14, 'Plaza', '', '') ;
INSERT INTO "NODES" VALUES (15, 'Colarin', 'TRUE', '') ;

--Populate EDGES
INSERT INTO "EDGES" VALUES (61, 1755, '', 1, 2, 'lift', 'open') ;
INSERT INTO "EDGES" VALUES (62, 1718, '', 2, 3, 'lift', 'open') ;
INSERT INTO "EDGES" VALUES (60, 2453, '', 4, 5, 'lift', 'open') ;
INSERT INTO "EDGES" VALUES (63, 123, '', 12, 2, 'lift', 'open') ;
INSERT INTO "EDGES" VALUES (64, 1050, '', 12, 6, 'lift', 'open') ;
INSERT INTO "EDGES" VALUES (65, 1041, '', 8, 7, 'lift', 'open') ;
INSERT INTO "EDGES" VALUES (66, 365, '', 9, 7, 'lift', 'open') ;
INSERT INTO "EDGES" VALUES (67, 1312, '', 11, 3, 'lift', 'open') ;
INSERT INTO "EDGES" VALUES (68, 360, '', 9, 10, 'lift', 'open') ;
INSERT INTO "EDGES" VALUES (69, 1365, '', 13, 10, 'lift', 'open') ;
INSERT INTO "EDGES" VALUES (70, 1223, '', 14, 13, 'lift', 'open') ;
INSERT INTO "EDGES" VALUES (71, 1151, '', 15, 14, 'lift', 'open') ;
INSERT INTO "EDGES" VALUES (100, 2600, 'black', 5, 4, 'run', 'open') ;
INSERT INTO "EDGES" VALUES (101, 3100, 'red', 3, 2, 'run', 'open') ;
INSERT INTO "EDGES" VALUES (102, 2500, 'black', 3, 2, 'run', 'open') ;
INSERT INTO "EDGES" VALUES (103, 2000, 'black', 3, 9, 'run', 'open') ;
INSERT INTO "EDGES" VALUES (104, 2100, 'red', 3, 9, 'run', 'open') ;
INSERT INTO "EDGES" VALUES (105, 1200, 'red', 9, 11, 'run', 'open') ;
INSERT INTO "EDGES" VALUES (106, 2000, 'red', 7, 11, 'run', 'open') ;
INSERT INTO "EDGES" VALUES (107, 1800, 'red', 7, 8, 'run', 'open') ;
INSERT INTO "EDGES" VALUES (108, 700, 'red', 7, 5, 'run', 'open') ;
INSERT INTO "EDGES" VALUES (1108, 1000, 'red', 5, 8, 'run', 'open') ;
INSERT INTO "EDGES" VALUES (109, 1900, 'blue', 6, 2, 'run', 'open') ;
INSERT INTO "EDGES" VALUES (110, 200, 'blue', 2, 12, 'run', 'open') ;
INSERT INTO "EDGES" VALUES (111, 700, 'blue', 10, 9, 'run', 'open') ;
INSERT INTO "EDGES" VALUES (112, 1500, 'red', 10, 13, 'run', 'open') ;
INSERT INTO "EDGES" VALUES (113, 700, 'black', 3, 5, 'run', 'open') ;
INSERT INTO "EDGES" VALUES (114, 600, 'blue', 6, 2, 'run', 'open') ;
INSERT INTO "EDGES" VALUES (116, 2100, 'red', 3, 9, 'run', 'open') ;
INSERT INTO "EDGES" VALUES (117, 2300, 'black', 12, 4, 'run', 'open') ;
INSERT INTO "EDGES" VALUES (118, 200, 'blue', 6, 5, 'run', 'open') ;Switch to the tab with one of table definitions, and click on Open Data. Then repeat it for the second table too.

There should be 15 rows in the table NODES and 31 rows in the table EDGES.
Copy following code into your SQL Editor and execute it.
SET SCHEMA "SKIING";

CREATE GRAPH WORKSPACE "SKIING"
  EDGE TABLE "EDGES"
    SOURCE COLUMN "start"
    TARGET COLUMN "end"
    KEY COLUMN "edge_id"
  VERTEX TABLE "NODES"
    KEY COLUMN "node_id"
;Find just created SKIING workspace in the Graph Workspaces folder of your schema.
Click on it to open its definition.

Right click on SKIING graph workspace and pick View Graph.
The graph viewer will open and load the initial view of graph.
Note, that the rendering of graph’s nodes and edges is different every time

Use Preferences to customize the view of the graph.

You should see labels of edges now.
In reality these lifts starting from the ticket offices can be used as well to go down. So, let’s add additional edges.
Add four new records to EDGES table by executing following INSERT statements in the SQL Console.
--Add lifts down to boarding stations
INSERT INTO "EDGES" VALUES (1061, 1755, '', 2, 1, 'lift', 'open') ;
INSERT INTO "EDGES" VALUES (1060, 2453, '', 5, 4, 'lift', 'open') ;
INSERT INTO "EDGES" VALUES (1070, 1223, '', 13, 14, 'lift', 'open') ;
INSERT INTO "EDGES" VALUES (1071, 1151, '', 14, 15, 'lift', 'open') ;Go back to Graph Viewer and click on Reset Graph.
Note, that the rendering of graph’s nodes and edges is different every time

You should see lift connections in both directions now.
Resources
Discussion
Share feedback on this tutorial or join the conversation in SAP Community.