
Overview


Prerequisites
Prerequisites
- Proficiency: Beginner
- Development environment: Apple iMac, MacBook or MacBook Pro running Xcode 9 or higher
- SAP BTP SDK for iOS: Version 2.1
- Tutorials: Sign up for a free trial account on SAP BTP and Enable SAP Mobile Services for development and operations
Steps
How-To Details
As of version 2.1, the SAP BTP SDK for iOS now incorporates a Chart Floor plan for data visualisation.
In this tutorial, you will use the Sample OData service to visualize stock item quantities using a bar chart.

Time to Complete
20 Min
On your local machine, navigate to your ./<SAP BTP SDK for iOS> folder. Double-click the SAP BTP SDK Assistant for iOS icon to start the application.
Click the Plus button on the top-right of the SAP BTP SDK Assistant for iOS. The first page of the Xcode Project generation wizard lets you define the Project Properties.
Enter the following details:
| Field | Value |
|---|---|
| Product Name | DataViz |
| Author | <your name> |
| Organization Name | <your company name> |
| Organization Identifier | com.sap.tutorials.demoapp |
| Destination | <choose a local destination> |

Click Next to advance to the SAP Mobile Services for development and operations Configuration step.
In the SAP Mobile Services for development and operations Configuration page, select the Sample tab button.
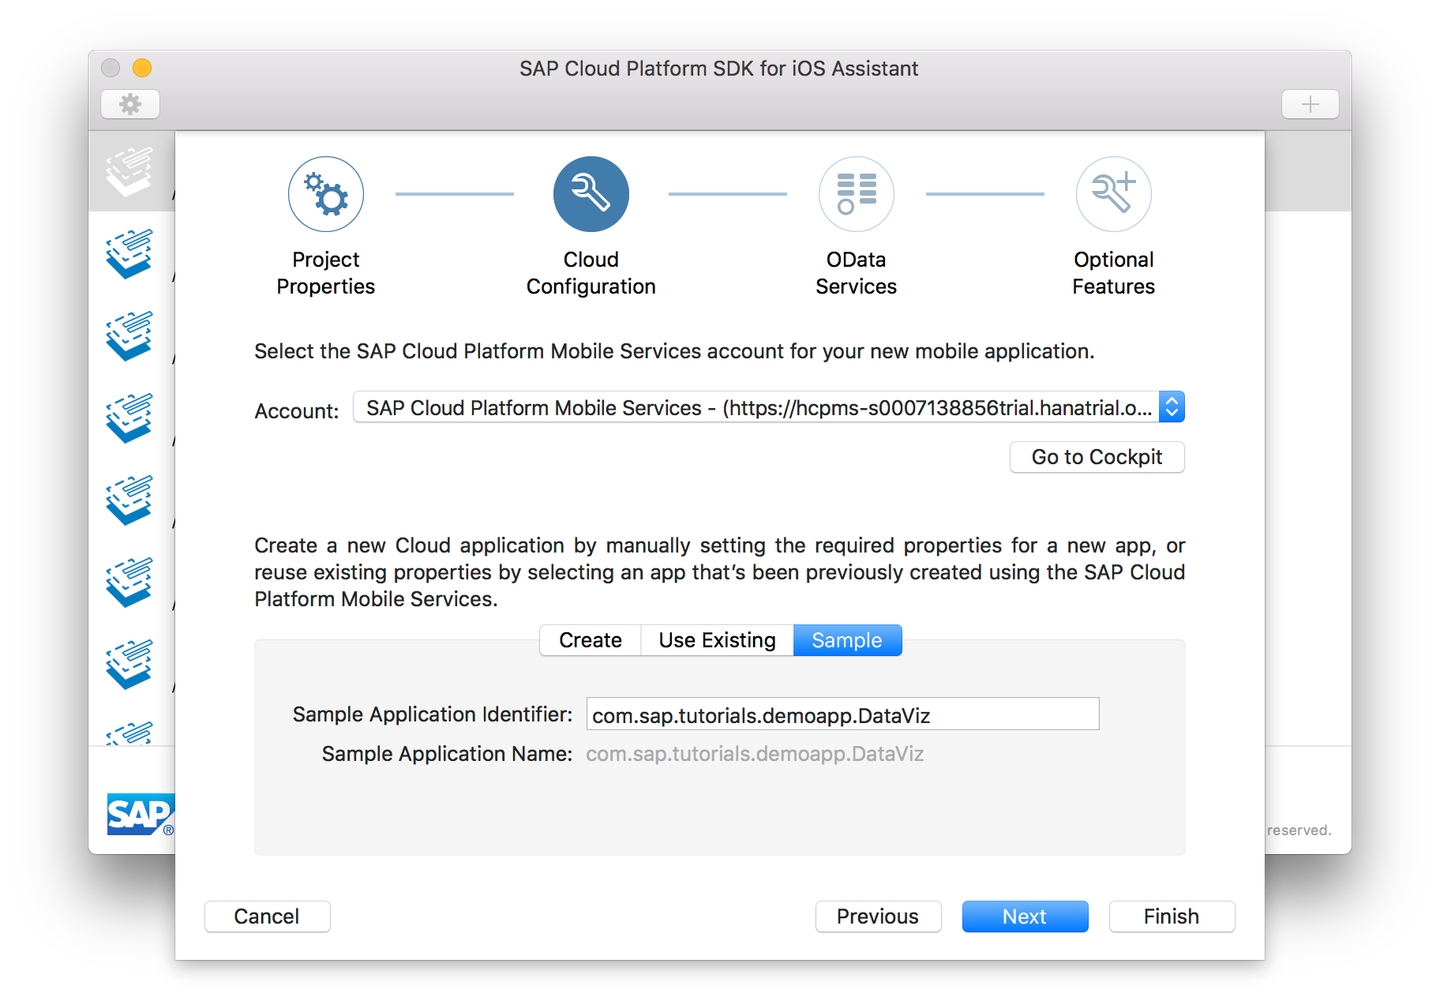
The Sample Application Identifier and Sample Application Name are now pre-filled with the Bundle Identifier value from the previous page.
Click Next to advance to the OData Services step.
In the OData Services page, the Sample OData service connection you have specified in the previous wizard step is displayed:

Click Next to advance to the Optional Features step.
In the Optional Features page, you have the option to generate a Master-Detail Application, enable logging and log uploads, and enable remote notifications. Since you’re using the Sample OData service, all settings are enabled but greyed out.

After you have clicked Finish in the previous step, the SAP BTP SDK Assistant for iOS now loads the OData service’s metadata. This metadata describes the data model, and can be accessed via <service URL>$metadata. For your service, the metadata URL would be https://hcpms-<your account>trial.hanatrial.ondemand.com/SampleServices/ESPM.svc/$metadata
After the SAP BTP SDK Assistant for iOS has finished, Xcode will launch and open the just generated DataViz project.

In Xcode, assign the appropriate development account to the project’s Team property in the General > Signing panel, and then build and run the app in the simulator.

Once the app has started, dismiss the push notifications message by clicking Allow.
The on-boarding landing page is now displayed:

Click the blue Start button, and in the SAML login screen, provide your SAP BTP credentials:

After you click Log on, the EULA screen is displayed:
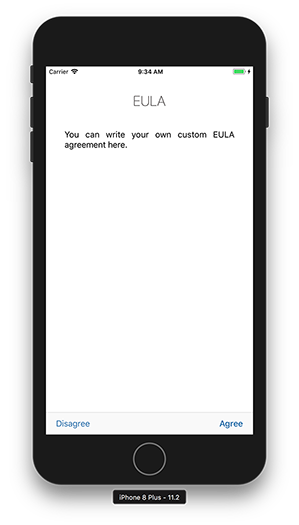
Click Agree, and the single entity collection is now shown:

In the Project navigator, navigate to the DataViz > ViewControllers > MyPrefixStock folder. Right-click this folder, and from the context menu, select New File…
In the dialog, select Swift File:

Click Next to continue. In the next page, save the file as StockChart

Click Create to finalize the wizard. The new file will now open.
First, add the necessary import statements:
import UIKit
import SAPFoundation
import SAPOData
import SAPFiori
import SAPCommon
Then, create an empty class:
class StockChartViewController: FUIChartFloorplanViewController {

    override func viewDidLoad() {
        super.viewDidLoad()
    }

}
Since the idea is to mimic the behavior of the StockMasterViewController file, but display the data in a chart instead of a table view, you need to reuse some functionality from this file.
Add the following private fields:
private let appDelegate = UIApplication.shared.delegate as! AppDelegate
private var myServiceClass: MyServiceClass<OnlineODataProvider> {
    return self.appDelegate.myServiceClass
}

private var entities: [MyPrefixStock] = [MyPrefixStock]( )
private let logger = Logger.shared(named: "MyPrefixStockMasterViewConterollerLogger")
private let okTitle = NSLocalizedString("keyOkButtonTitle",
                                        value: "OK",
                                        comment: "XBUT: Title of OK button.")
These will hold, among others, references to the appDelegate file, the OData service class, and stores the retrieved Stock entities in the entities field.
To load the Stock data, add the following methods (which are derived from the existing master view controller file) :
private func updateChartView() {
    let oq = OperationQueue()
    oq.addOperation({
        self.loadData {
        }
    })
}

private func loadData(completionHandler: @escaping () -> Void) {
    self.requestEntities { error in
        defer {
            completionHandler()
        }
        if let error = error {
            let alertController = UIAlertController(title: NSLocalizedString("keyErrorLoadingData", value: "Loading data failed!", comment: "XTIT: Title of loading data error pop up."), message: error.localizedDescription, preferredStyle: .alert)
            alertController.addAction(UIAlertAction(title: self.okTitle, style: .default))
            OperationQueue.main.addOperation({
                // Present the alertController
                self.present(alertController, animated: true)
            })
            self.logger.error("Could not update table. Error: \(error)", error: error)
            return
        }
        OperationQueue.main.addOperation({
            self.renderChart()
            self.logger.info("Chart updated successfully!")
        })
    }
}

func requestEntities(completionHandler: @escaping (Error?) -> Void) {
    // Only request the first 20 values. If you want to modify the requested entities, you can do it here.
    let query = DataQuery().selectAll().top(20)
    self.myServiceClass.fetchStock(matching: query) { stock, error in
        guard let stock = stock else {
            completionHandler(error!)
            return
        }
        self.entities = stock
        completionHandler(nil)
    }
}This will give an error, stating the class has no member renderChart. This method will be implemented in the next step
Add the following 3 methods:
private func initChart() {
    title = "Stock Overview"

    titleText.text         = "Total Stock available"
    status.text            = "Click chart for details"
    categoryAxisTitle.text = "Quantity"
    valuesAxisTitle.text   = "Stock Item"

    headerView.dataSource = self

    renderChartSummaryItem(values: [""])
}

private func renderChart() {

    chartView.chartType         = .bar
    chartView.numberOfGridlines = 4
    chartView.dataSource        = self
    headerView.dataSource       = self

    let values: [Double] = {
        var values: [Double] = []
        for series in chartView.series {
            let categoriesUpperBound = series.numberOfValues - 1
            if let valuesInSeries = series.valuesInCategoryRange((0...categoriesUpperBound), dimension: 0) {
                values.append(valuesInSeries.flatMap({ $0 }).reduce(0.0, +))
            }
        }
        return values
    }()

    renderChartSummaryItem(values: values.map { $0.description })
}

private func renderChartSummaryItem(values: [String]) {
    let item = FUIChartSummaryItem()

    item.categoryIndex = -1
    item.isEnabled = false
    item.isPreservingTrendHeight = false

    item.valuesText = values
    item.title.text = "Stock Details"

    headerView.addItem(item)
}The first method sets the ‘static’ details for the chart, and will be called from the viewDidLoad() method.
The second method is called once the OData service has returned data (and was missing in the previous step)
The third method is called from the previous two methods, and will display a summary of the data when clicking on the chart.
You will also see a couple of other errors. This is because the class needs a couple of delegates which aren’t referenced yet. This will be corrected in the next step.
Add the following two extensions:
extension StockChartViewController: FUIChartSummaryDataSource {

    func chartView(_ chartView: FUIChartView, summaryItemForCategory categoryIndex: Int) -> FUIChartSummaryItem? {

        let item = FUIChartSummaryItem()

        item.categoryIndex = categoryIndex
        item.isEnabled = true
        item.isPreservingTrendHeight = false

        let values: [Double] = {
            var values: [Double] = []
            for series in chartView.series {
                values.append(series.valueForCategory(categoryIndex, dimension: 0)!)
            }
            return values
        }()

        item.valuesText = values.map { $0.description }
        item.title.text = chartCategoryTitles()[categoryIndex]

        return item
    }
}

extension StockChartViewController: FUIChartViewDataSource {

    func chartSeriesTitles() -> [String] {
        return ["Stock"]
    }

    func chartCategoryTitles() -> [String] {
        return entities.map{$0.productID!}
    }

    func chartData() -> [[Double]] {
        return [entities.map{$0.quantity!.doubleValue()} /*, entities.map{$0.minStock!.doubleValue()} */ ]
    }

    func numberOfSeries(in: FUIChartView) -> Int {
        return chartData().count
    }

    func chartView(_ chartView: FUIChartView, numberOfValuesInSeries seriesIndex: Int) -> Int {
        return chartData()[seriesIndex].count
    }

    func chartView(_ chartView: FUIChartView, valueForSeries series: Int, category categoryIndex: Int, dimension dimensionIndex: Int) -> Double? {
        return chartData()[series][categoryIndex]
    }

    func chartView(_ chartView: FUIChartView, formattedStringForValue value: Double, axis: FUIChartAxisId) -> String? {
        return value.description
    }

    func chartView(_ chartView: FUIChartView, titleForCategory categoryIndex: Int, inSeries seriesIndex: Int) -> String? {
        return chartCategoryTitles()[categoryIndex]
    }

}The first delegate is called when an item on the cart is clicked.
The second delegate populates the chart with the OData entities values (see the mapped values in chartCategoryTitles() and chartData() methods).
Add the following method calls in the viewDidLoad() method:
initChart()
updateChartView()The final step is to bind the view controller to a view.
In the Project navigator, navigate to DataViz > ViewControllers > MyPrefixStock and open MyPrefixStock.storyboard.
From the Object library, drag a View Controller to the storyboard.
In the Identity inspector, set the Custom Class to StockChartViewController.
Set its storyboard ID to StockDataViz.

In the Attributes inspector, set the view to be the Initial View Controller.
You may remove the other views in the storyboard.
Navigate up to DataViz > ViewControllers and open file CollectionsViewController.swift.
Locate method collectionSelected and change the switch for .myPrefixStock to load the new view with ID StockDataViz:
case .myPrefixStock:
    let myPrefixStockStoryBoard = UIStoryboard(name: "MyPrefixStock", bundle: nil)
    masterViewController = myPrefixStockStoryBoard.instantiateViewController(withIdentifier: "StockDataViz")
masterViewController.navigationItem.title = "Stock"Build and run the application.
Once loaded, select the Stock collection. It should now display the stock quantities in a bar graph:
Select one of the chart items. It should now display the summary info at the top:

Resources
Discussion
Share feedback on this tutorial or join the conversation in SAP Community.