
Trace an SAP HANA Client Connection
Enable trace settings for applications using SAP HANA Client interfaces.
Overview
You will learn
- How to enable tracing using
hdbsqldbc_cons, environment variables, or connection parameters - How to direct trace details to a file,
stdout,stderr, or to a callback


Prerequisites
Prerequisites
- You have completed the first 3 tutorials in this mission.
Steps
Intro
Trace files can help SAP Support diagnose unexpected behavior.
Tracing can be configured using executables included with the SAP HANA Client installation. SQLDBC-based interfaces use hdbsqldbc_cons, except for ODBC, which uses hdbodbc_cons. For JDBC, use ngdbc.jar.
Trace settings can also be configured using environment variables, or via connection parameters.
Enter the following command to see the current trace settings:
Shellhdbsqldbc_cons SHOW ALL
hdbsqldbc_cons SHOW ALL Results hdbsqldbc_consutility can be found in thesap/hdbclientfolder.To enable tracing of SQL statements at the INFO level, to enable tracing of TIMING info, and to specify the trace file location and name, enter the following commands:
Shellhdbsqldbc_cons TRACE SQL ON LEVEL INFO hdbsqldbc_cons TRACE TIMING ON mkdir c:\temp\traces hdbsqldbc_cons TRACE FILENAME c:\temp\traces\SQLDBC-%p.txtShellhdbsqldbc_cons TRACE SQL ON LEVEL INFO hdbsqldbc_cons TRACE TIMING ON mkdir -p /tmp/traces hdbsqldbc_cons TRACE FILENAME /tmp/traces/SQLDBC-%p.txtThe
%pwill be replaced with the process ID of the traced application. Including%pin the file name ensures that each process can write its own trace file.The next step provides an example of sending the trace output to
stdoutorstderr. Another option for Node.js applications is to specify a callback to receive the trace output to using theonTracemethod which is shown in the tutorial Connect Using the SAP HANA Node.js Interface.Example trace categories include:
- API
- SQL
- TIMING
Some trace categories such as SQL also have severity levels:
- DEBUG
- INFO
- WARNING
- ERROR
- FATAL
For more information, see SQLDBC Tracing.
To see the current settings run:
Shellhdbsqldbc_cons SHOW ALL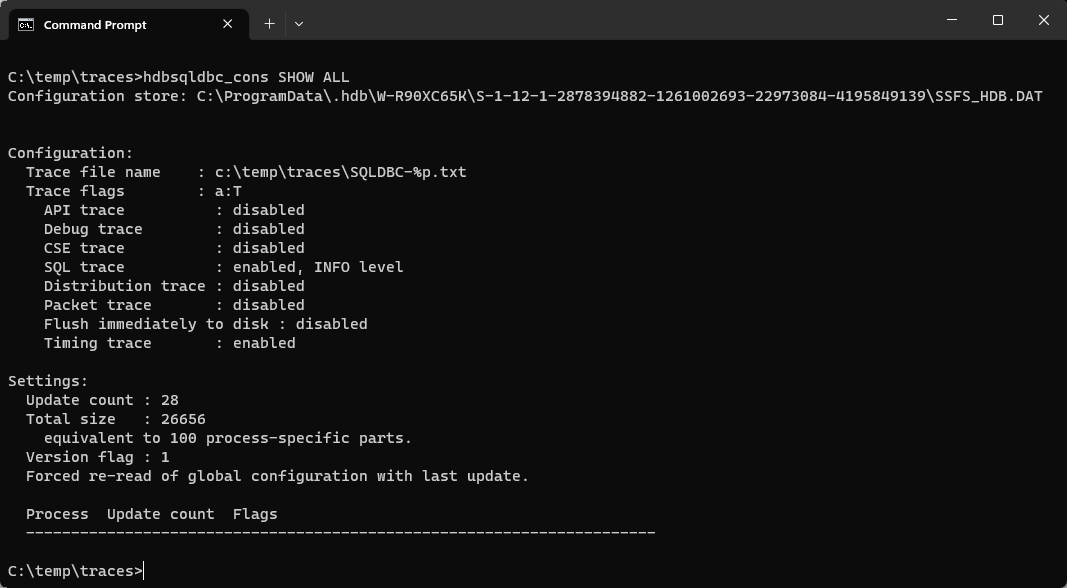
trace settings Run the following command to connect to HDBSQL and query for the status. Since tracing is enabled, a trace file will be generated and can be used to see which SQL statements are called by
\s.Shellhdbsql -U User1UserKey "\s"Find and open the generated trace file. Remember to replace #### to match the trace file name you wish to open.
Shellcd c:\temp\traces dir SQLDBC*.txt /od notepad SQLDBC-####.txtShellcd /tmp/traces ls -lt pico SQLDBC-####.txt
Replace Process ID Notice that the trace settings are shown at the top of the file.
CodelibSQLDBCHDB 2.16.18.1676320318 SYSTEM: Microsoft Windows / X64 BUILD AT: 2023-02-13 20:43:00 BRANCH: unknown BUILD MODE: rel APPLICATION: C:\SAP\hdbclient\hdbsql.exe HOST: W-R90XC65K OS USER: I234567 CURRENT DIRECTORY: c:\temp\traces TRACE FILE NAME: c:\temp\traces\SQLDBC-55652.txt PROCESS ID: 55652 TRACE FILE WRAP COUNT: 0 --- Enabled Traces: SQL Trace: Level INFO Distribution Trace: Level INFO Timing Trace ---If the trace settings change while tracing is enabled, the Enabled Traces section will appear again in the trace file.
If you are experiencing issues with SQLDBC tracing, consult Troubleshooting SQLDBC Tracing.
Search through the trace file and notice the SQL statements that were executed.
Code::PREPARE SQLCURS_1 2023-04-07 12:46:38.497000 [0x000002540c111af0] SQL COMMAND: SELECT VERSION FROM SYS.M_DATABASETo turn off tracing for all categories, run the following command:
Shellhdbsqldbc_cons TRACE OFF hdbsqldbc_cons SHOW ALL
The following are some additional options for tracing.
The FLUSH setting, when turned on, can reduce I/O activity. If you are investigating a crash, it should be turned on to ensure that all the trace information is recorded.
Shellhdbsqldbc_cons TRACE FLUSH ONNote that tracing should be turned off when not in use, as it does impact performance, memory and disk size. The following are some additional options to limit the trace file size to 100 KB (plus an archive file) and to turn on tracing only when a specific error code occurs. Error code 10 occurs when invalid credentials are used.
Shellhdbsqldbc_cons TRACE SIZE 100K hdbsqldbc_cons TRACE ONLY ON ERROR 10Filtering can be used to reduce the size of trace files. Place the following SQL statements into a file named sql.sql to try this out.
SQLSELECT 'tracetestUSER1' FROM DUMMY; CONNECT USER2 PASSWORD Password2; SELECT 'tracetestUSER2' FROM DUMMY;Execute the commands below to reset the trace settings, enable SQL trace for USER2, and then to run the above SQL statements which will execute as USER1 and then as USER2.
Shellhdbsqldbc_cons TRACE OFF hdbsqldbc_cons TRACE SQL ON LEVEL INFO hdbsqldbc_cons TRACE FILTER SQL USER USER2 hdbsql -U User1UserKey -I sql.sqlThe expected result is that the resulting trace file only traces the query from USER2.
While filtering by user is useful for isolating activity from a specific connection, it may still include multiple SQL statements. To further narrow the trace output, you can filter by a specific SQL statement using its hash value.
To enable filtering by statement hash, you will need to obtain the MD5 value of the SQL statement. Update the sql.sql file with the following:
SQLSELECT 'tracetestUSER1' FROM DUMMY; CONNECT USER2 PASSWORD Password2; SELECT 'tracetestUSER2' FROM DUMMY; SELECT * FROM HOTELS.CUSTOMER;To obtain the MD5 value, enter the following command:
Shellecho -n " SELECT * FROM HOTELS.CUSTOMER" | md5sumEnsure the SQL statement does not include a trailing semicolon (;) when calculating the MD5 hash.
Execute the commands below to reset the trace settings, enable SQL to trace for the hash statement, and then to run the above SQL statements.
Shellhdbsqldbc_cons TRACE OFF hdbsqldbc_cons TRACE SQL ON LEVEL INFO hdbsqldbc_cons TRACE FILTER STATEMENT HASH "658d31bfb941b60f99decfbaf7f80b3f" hdbsql -U User1UserKey -I sql.sqlThe expected result is that the resulting trace file only traces the specific SQL statement.
Filtering can be done on the following categories:
- APPLICATION USER
- CONNECTION ID
- SQL USER
- STATEMENT HASH
- STATEMENT
For more information, see hdbsqldbc_cons Trace Options.
In situations where
hdbsqldbc_consis not accessible, perhaps because a driver was installed directly using npm or pip, trace settings can be set using environment variables. The following values can be used in the trace file name.- %p represents the process ID
- %a represents the application user
- %c represents the connection ID
Shellset HDB_SQLDBC_TRACEFILE=c:\temp\traces\SQLDBC-%p.txt set HDB_SQLDBC_TRACEOPTS=SQL=INFO,FLUSHShellexport HDB_SQLDBC_TRACEFILE=/tmp/traces/SQLDBC-%p.txt export HDB_SQLDBC_TRACEOPTS=SQL=INFO,FLUSHTrace settings in environment variables take precedence over those set using
hdbsqldbc_cons.The environment variable values can be seen and removed with the following commands. The first and last commands display what the environment variable is set to. The middle command removes the value of the environment variable.
Shellset HDB_SQLDBC_TRACEFILE set HDB_SQLDBC_TRACEFILE= set HDB_SQLDBC_TRACEFILE set HDB_SQLDBC_TRACEOPTS set HDB_SQLDBC_TRACEOPTS= set HDB_SQLDBC_TRACEOPTSShellprintenv | grep HDB_SQLDBC_TRACE unset HDB_SQLDBC_TRACEFILE unset HDB_SQLDBC_TRACEOPTS printenv | grep HDB_SQLDBC_TRACE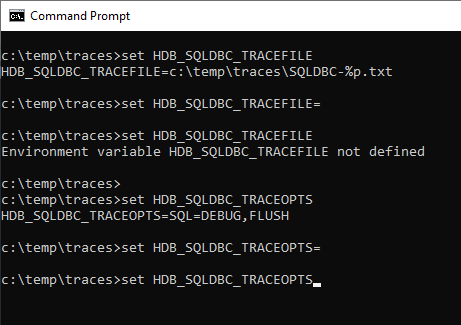
Environment Variable Values Trace information can be directed to
stdoutorstderr. See below for a few examples.Shellhdbsql -U User1UserKey -Z traceFile=stdout -Z traceOptions=sql=warning "SELECT * FROM HOTELS.CUSTOMER"Shellset HDB_SQLDBC_TRACEOPTS=SQL=WARN set HDB_SQLDBC_TRACEFILE=stdout hdbsql -U User1UserKey "SELECT * FROM HOTELS.CUSTOMER" set HDB_SQLDBC_TRACEOPTS= set HDB_SQLDBC_TRACEFILE=Tracing can also be enabled in an application’s connection properties. For further details see
traceFileandtraceOptionsin SQLDBC Connection Properties.
Java must be installed in order to complete the following steps. To check if it is installed, run the following commands:
java -version
javac -version
To show the current JDBC tracing configuration, run the following command:
Shelljava -jar C:\SAP\hdbclient\ngdbc.jar SHOWShelljava -jar ~/sap/hdbclient/ngdbc.jar SHOWAlternatively, the trace settings can be viewed and set using a GUI.
Shelljava -jar C:\SAP\hdbclient\ngdbc.jarShelljava -jar ~/sap/hdbclient/ngdbc.jar
JDBC Driver GUI Turn on the tracing for SQL statements using either the GUI or the commands below:
Shelljava -jar C:\SAP\hdbclient\ngdbc.jar TRACE ON java -jar C:\SAP\hdbclient\ngdbc.jar TRACE FILENAME C:\temp\traces\jdbctrace java -jar C:\SAP\hdbclient\ngdbc.jar TRACE API ONShelljava -jar ~/sap/hdbclient/ngdbc.jar TRACE ON java -jar ~/sap/hdbclient/ngdbc.jar TRACE FILENAME ~/tmp/traces/jdbctrace java -jar ~/sap/hdbclient/ngdbc.jar TRACE API ONThe different command-line option keywords can be found at JDBC Tracing and Trace Options.
Execute a query which will generate a trace file.
Shelljava -jar c:\sap\hdbclient\ngdbc.jar -k USER1UserKey -o encrypt=True -o validatecertificate=false -c "SELECT * FROM HOTELS.CUSTOMER"Shelljava -jar ~/sap/hdbclient/ngdbc.jar -k USER1UserKey -o encrypt=True -o validatecertificate=false -c "SELECT * FROM HOTELS.CUSTOMER"Examine the trace file by using the
catcommand (Linux or Mac) or thetypecommand on Windows.Code<html><head><meta http-equiv="Content-Type" content="text/html; charset=utf-8"></head><body><PRE><PLAINTEXT> Java version: 11 ClassLoader: jdk.internal.loader.ClassLoaders$AppClassLoader@30946e09 Process ID: 47584 Driver version: package com.sap.db.jdbc, JDBC, version 4.2, SAP HANA JDBC Driver, SAP SE, 2.16.9-62f3b9598d4106abb5cce5562c88d3abecca5580 Trace configuration: Levels: API,PACKET,CONNECTIONS,CLEANERS Show plain-text client-side encrypted values: Disabled Show timestamps: Disabled Show elapsed times: Disabled Trace file size: Unlimited Stop on error: Disabled ... com.sap.db.jdbc.HanaConnectionClean@731f8236[ID:202968].createStatement() => com.sap.db.jdbc.HanaStatement@117159c0 com.sap.db.jdbc.HanaStatement@117159c0.execute("SELECT * FROM HOTELS.CUSTOMER")Tracing information can be sent to
stdoutorstderras shown below.Shelljava -jar c:\sap\hdbclient\ngdbc.jar -k User1UserKey -o traceFile=stdout -o traceOptions=CONNECTIONS -c "SELECT * FROM HOTELS.CUSTOMER"Shelljava -jar ~/sap/hdbclient/ngdbc.jar -k USER1UserKey -o traceFile=stdout -o traceOptions=CONNECTIONS -c "SELECT * FROM HOTELS.CUSTOMER"Tracing can also be enabled via the connection parameters. For further details see Trace a JDBC Connection Using a Connection String.
Congratulations, you have now configured tracing with the SAP HANA client!
Resources
Discussion
Share feedback on this tutorial or join the conversation in SAP Community.